Why an Expensive Country Feels Broke: America's Hidden Safety Net
By Courtney Turrin · September 23, 2026 · 14 min read read
Category: For Curious People
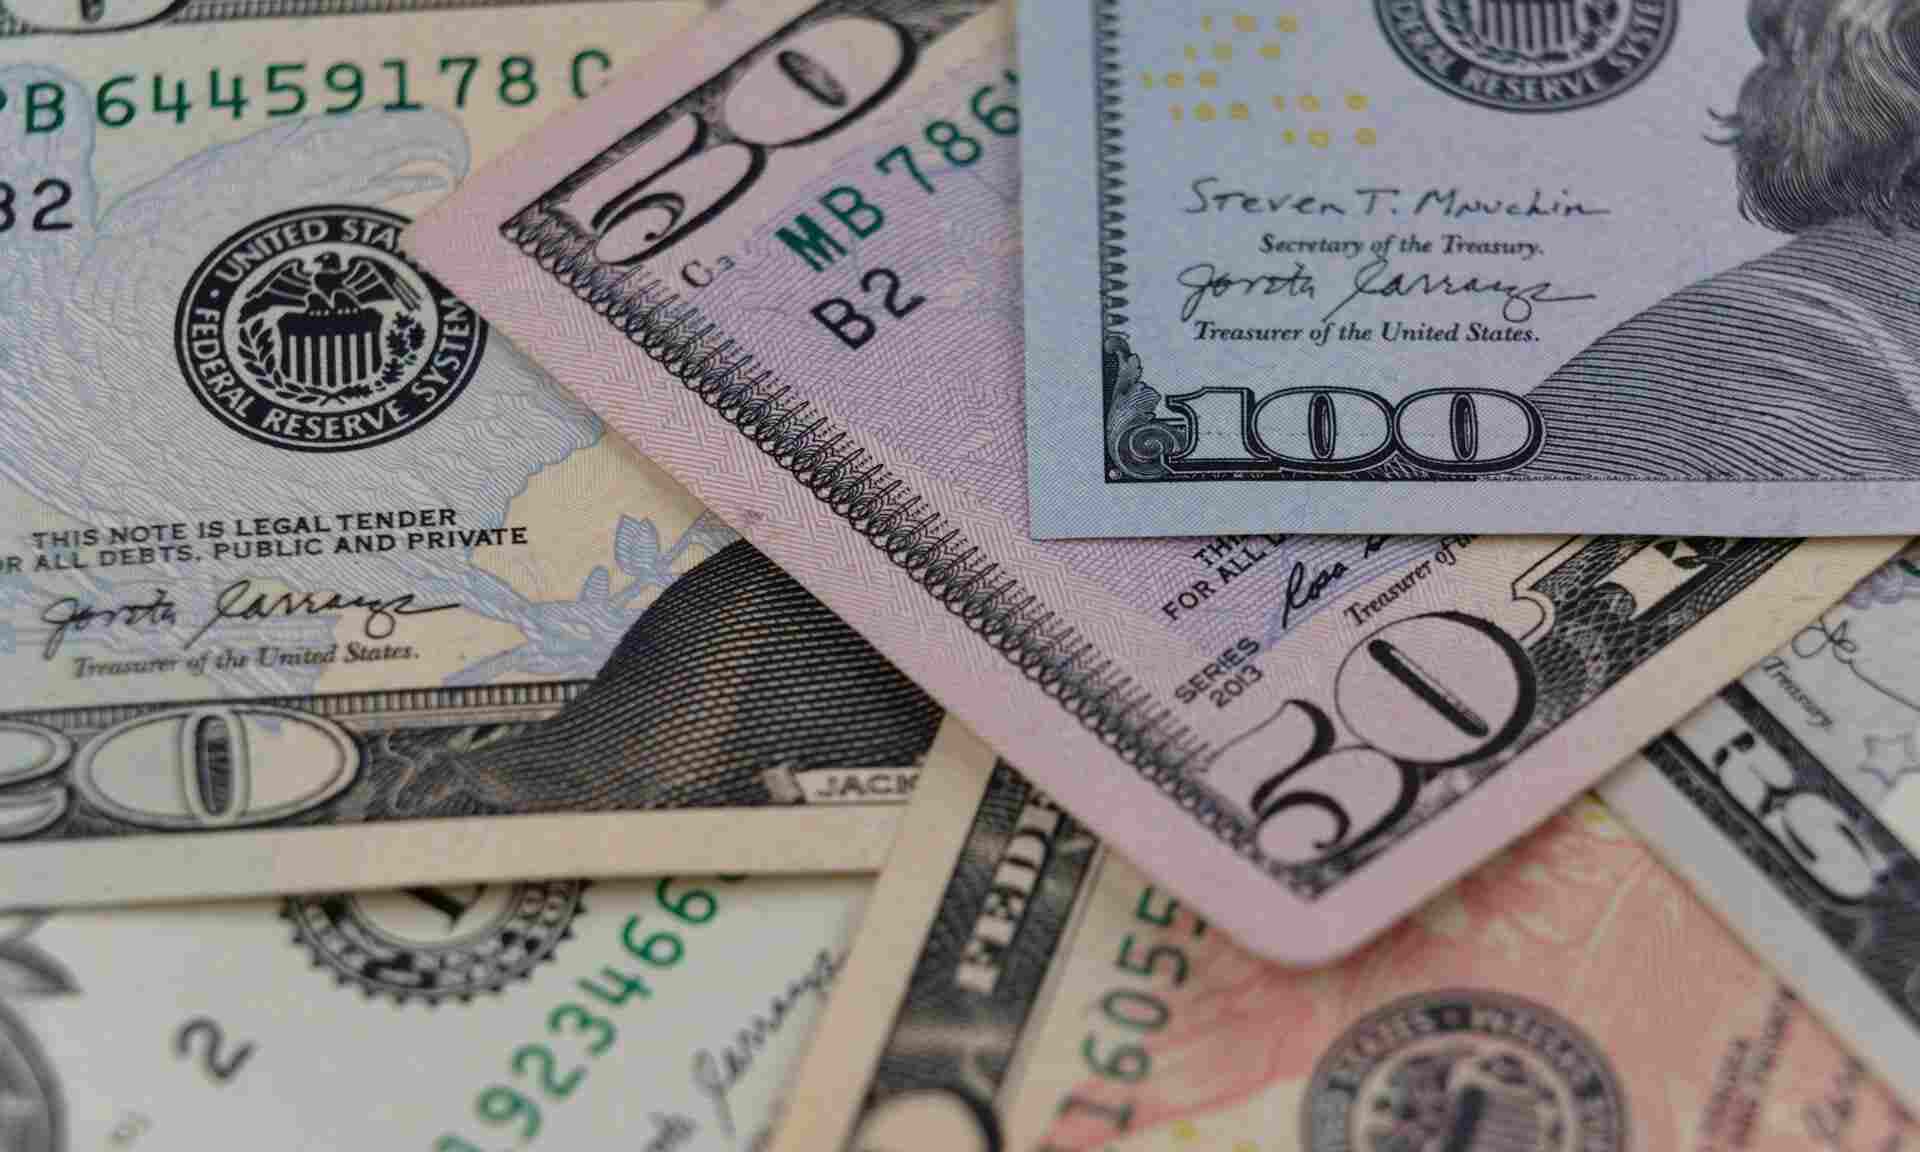
The United States spends near the top of the developed world on social protection. But the way that money moves determines which households it reaches.
Measure total spending on social protection instead of just the share that moves through a government budget, and the United States ranks among the highest-spending countries in the developed world.
That is not the reputation most Americans have in mind. Citizens see a country that taxes lightly, spends thinly on public programs, and leaves people to buy privately what other countries provide through government.
For many Americans, rising prices feel unbearable, wages do not seem to move, and there is a sense that as the federal debt grows, the dollars keep disappearing before they reach anyone.
Where the Money Actually Lands
The Organisation for Economic Co-operation and Development (OECD) keeps two different scorecards for how much a country spends on social protection, and these two measures produce almost opposite outcomes for the United States.
The first scorecard counts gross public social spending: pensions, health coverage, unemployment insurance, family benefits, all measured as money that moves through a government budget. On that scorecard, using the last full pre-pandemic comparison year, the United States ranked 23rd out of 38 OECD countries, well below the average. This is the number that is experienced by average Americans as a thin safety net.
The second scorecard, net total social spending, adds an additional layer onto the first metric: private spending on health insurance and pensions, plus the value of tax breaks designed to substitute for public benefits, minus the taxes governments claw back on benefit income. On that measure, the United States jumped from 23rd to 2nd, behind only France, according to the OECD's comparative analysis (Figure 1).
[datawidget key="net-vs-gross-social-spending"]
Political scientist Suzanne Mettler named this pattern "the submerged state" in a 2011 book by that title, and Christopher Howard mapped its scale more than a decade earlier in The Hidden Welfare State (1997). Both showed that routing spending through tax breaks and employer mandates, rather than a government check, delivers the same benefit while obscuring the government's role in providing it.
Three things have changed since Mettler and Howard's publications. (1) Interest on the federal debt has just overtaken defense spending and Medicaid for the first time. (2) The usual defense-spending explanation for the tax gap, that Europe can tax less because the United States covers the majority cost of collective defense, does not hold up once defense spending is measured the same way as the tax gap, as a share of each economy. And (3) in Virginia, a state economy substantially built on that same borrowed federal money is now watching the spending behind it contract.
Private social spending, mostly employer-sponsored health insurance and 401(k)-style retirement plans, ran at 12.8 percent of GDP in the United States as of 2021, nearly four times the OECD average of 3.5 percent and behind only Switzerland. Tax breaks with a social purpose add still more on top. The OECD's writeup states that a higher ranking in net total social spending does not necessarily contribute to more equal outcomes, because tax advantages tend to benefit higher earners more than people with little or no tax liability, and workers without access to employer benefits do not see any of it (Figure 2).
[datawidget key="private-social-spending-share"]
The finding is that America already spends European-level money on social protection. It just spends it through employers, insurers, and the tax code instead of through a government check, and that routing changes who the money reaches.
Same Spending, Roughly Double the Price
Nowhere does that routing show up more starkly than in healthcare, the largest single category of private social spending in the country.
In 2024, the United States spent an estimated $14,885 per person on healthcare, according to the Peterson-KFF Health System Tracker's analysis of OECD Health Statistics. The average for other large, wealthy OECD countries, a peer group chosen specifically because it excludes lower-income nations that would not fairly compare, was $7,371 per person. Compared to its peers, the United States is spending roughly double per person, and a large share of that spending runs through private insurers and employer plans rather than a public system (Figure 3).
[datawidget key="us-vs-oecd-health-spending"]
This is the detail that gets lost in the standard comparison to Europe. It is common to hear that Americans forgo the taxes that would pay for public healthcare and low-cost university, and that the trade is worth it because take-home pay is higher. The private spending data tells a different story: much of that money is still leaving American households, just later, less predictably, and attached to a paycheck instead of a tax bracket.
The Tax Gap Comes Down to Collection Method, Not Military Budgets
If Americans are already spending this kind of money on healthcare and retirement, the obvious next question is why the government itself collects so much less in taxes than European governments do.
Call this the tax-collection gap: total tax revenue in the United States equaled 25.6 percent of GDP in the most recent OECD data, against an OECD average of 34.1 percent, a gap of roughly 8.5 percentage points.
One common explanation is military spending: the idea that European governments can direct more of their tax revenue toward healthcare and education because the United States shoulders the cost of collective defense. If that were the main driver, the defense-spending gap between the U.S. and Europe, measured as a share of each economy, should be close to the same size as the tax-collection gap. It is not.
The United States spent about 3.1 percent of GDP on its military in 2025, according to SIPRI. European NATO members averaged about 2.2 percent of GDP the same year, according to an analysis by the International Institute for Strategic Studies. That is a defense-spending gap of less than one percentage point, not the 8.5 points on the tax side. Following NATO's 2025 summit in The Hague, every member of the alliance now meets or exceeds the 2 percent of GDP floor, and all have committed to reaching 5 percent by 2035, which will close this small gap further. Placed on the same scale, the two gaps are not close (Figure 4).
[datawidget key="tax-vs-defense-gap-comparison"]
A one-point defense gap cannot explain an 8.5-point tax-collection gap. The money is not missing from U.S. tax revenue because it went to the military instead. It is missing because Americans are already paying the equivalent amount somewhere else, through the employer premiums, deductibles, and retirement-account contributions described above.
The Debt That Was Never Meant to Be Paid Off Through Taxes
None of this means military spending is irrelevant to the larger picture. It shows up in a different part of the ledger: how much of the country's core spending was financed by debt rather than by taxes.
The post-9/11 wars in Iraq, Afghanistan, and elsewhere are estimated by Brown University's Costs of War project, an effort founded to track war costs it argues are undercounted in official figures, at roughly $8 trillion when veterans' care and accrued interest are included. That estimate includes more than $1 trillion in interest payments alone, because as the project's researchers note, this was the first time in the country's history that a war was financed almost entirely through debt rather than through dedicated taxes, war bonds, or both (Figure 5).
[datawidget key="cost-of-war-breakdown"]
That distinction, taxed versus borrowed, is not a technicality. It determines whether the spending shows up as a tax bill today or a debt payment for decades afterward. The country chose the second option, and the bill has been arriving as interest ever since.
Interest on the national debt hit $1.0 trillion in fiscal year 2026, according to the Congressional Budget Office. That figure now exceeds the $885 billion projected for national defense and the $708 billion projected for Medicaid, making interest the fastest-growing major line in the federal budget (Figure 6).
[datawidget key="interest-vs-defense-medicaid"]
CBO's budget decomposition makes the mechanism visible. The primary deficit, what the government would run if interest costs did not exist, is projected to fall from 2.6 percent of GDP in 2026 to 2.1 percent in 2036. The total deficit rises anyway, from 5.8 percent to 6.7 percent of GDP, because interest costs are growing faster than all budget cuts combined. Debt held by the public is projected to climb from 101 percent of GDP this year to 120 percent by 2036, surpassing the previous all-time high set just after World War II (Figure 7). The debt is now growing mostly because of the debt.
[datawidget key="debt-trajectory-2026-2036"]
How Debt Affects a Grocery Bill
There is a version of this argument that says none of it matters, because plenty of countries carry enormous debt without inflation to show for it. Japan is the standard example, with gross public debt above 230 percent of GDP and, for most of the last three decades, deflation rather than inflation.
That is not a success story. Japan's deflationary decades came with their own damage: wages that barely moved for a generation, businesses that held back on investment because prices and demand kept falling, and an economy that grew only slowly while its population aged and shrank. The absence of inflation did not mean the absence of economic pain. It meant a different kind of pain.
Japan is still useful here, not as a model but as a demonstration of the mechanism. Its debt is held almost entirely by its citizens and institutions, in its currency, and markets have never doubted it would be serviced. Debt alone does not generate inflation. Inflation occurs when there is debt that markets expect will not be repaid through future taxation.
That distinction is the center of a body of research, most prominently a 2023 paper in the Quarterly Journal of Economics that models what the authors call unfunded fiscal shocks: government spending that is not expected to be offset by future tax increases or spending cuts. Modeling the post-pandemic period, the authors compare two versions of the same spending: left as debt, it pushed the modeled inflation peak to 6.3 percent; paired with future tax increases instead, the modeled peak was only 3.7 percent. The model was also able to predict the inflationary effect of the 2021 American Rescue Plan out of sample, using only real-time fiscal data (Figure 8).
[datawidget key="fiscal-inflation-mechanism"]
This is a mathematical demonstration of an intuition a lot of people already have: that borrowing to cover spending eventually affects prices.
The Gap Between What Things Cost and What People Take Home
Median household income in 2024 was $83,730, according to the Census Bureau's most recent report, a figure the Bureau describes as not statistically different from 2019's $83,260, a change of roughly half a percent. Five years produced no meaningful gain in the middle of the income distribution. Income at the 90th percentile, meanwhile, rose 4.2 percent over just the two years from 2022 to 2024 (Figure 9).
[datawidget key="income-by-percentile-2019-2024"]
Housing shows the same pattern in sharper relief. Home prices have risen 53 percent since 2019, while median household income has risen only 24 percent over the same period, according to the National Association of Home Builders. The consequence is visible in who is buying: the share of first-time homebuyers has fallen to 21 percent of the market, down from 44 percent in 1981, and the median age of a first-time buyer has climbed to 40, up from 29 in 1981 (Figure 10).
[datawidget key="home-price-vs-income-growth"]
This is also the data behind the sense, widely shared and increasingly well documented, that the basic promise of doing better than the previous generation has weakened. Economist Raj Chetty and his coauthors, in a widely cited 2017 study in Science, found that the share of children who grow up to earn more than their parents fell from 91.5 percent for people born in 1940 to 50.3 percent for people born in 1984 (Figure 11). In the same study, Chetty and his coauthors modeled two counterfactuals: restoring the more even distribution of economic growth seen in 1940 would lift the 1980s cohort's mobility rate to about 80 percent, while restoring 1940's growth rate alone, with today's distribution, would lift it only to about 62 percent. Income distribution, not growth, is the primary driver.
[datawidget key="absolute-mobility-by-cohort"]
Put alongside the social-spending numbers, a pattern comes into focus. The country is not short on money moving through the system. It is short on that money reaching the median household fast enough to keep pace with rising costs, especially in housing and health care, the categories where prices have detached furthest from wages.
No State Banked More of the Borrowed Money Than Virginia
Richmond readers do not have to look far to see this mechanism at work. No state received more of the country's federal spending, dollar for dollar, than Virginia.
Virginia consistently ranks first among all states in total federal spending per capita, and net federal funding into the state runs to roughly $10,301 per resident, the highest figure in the country, according to the Virginia House Appropriations Committee. Nearly a quarter of the state's economy relies on federal spending, and in 2023 alone, the federal government spent $109 billion with Virginia employers, concentrated in Department of Defense and Department of Veterans Affairs contracts. Almost half of that federal contract spending, $53.7 billion, ran through the professional, scientific, and technical services sector, the consultants, engineers, and technology firms that ring Washington and increasingly extend down I-95 (Figure 12).
[datawidget key="virginia-federal-spending-per-capita"]
Virginia is one of the largest single destinations for the borrowed money described earlier: the wars financed by debt rather than taxes. The state did not just host federal spending. It built a substantial share of its economy on top of it.
That bet is now working in reverse. The University of Virginia's Weldon Cooper Center revised its estimate of Virginia's 2025 job losses to 10,400, worse than initially reported, and projects the state will lose another 17,800 jobs in 2026 as federal workforce reductions and contract cancellations ripple through the economy. Government, professional services, and manufacturing accounted for most of the losses. Unemployment is projected to keep climbing through the year even as the state avoids an outright recession.
Housing has not caught up with the recent contractions. Richmond-area home prices rose roughly 36 percent from 2015 to 2020, then another 49 percent from 2020 to early 2026, more than doubling over the decade, according to Federal Housing Finance Agency house price index data. Part of that second run traces to a specific migration pattern: the rate of Northern Virginia residents moving into the Richmond region rose about 36 percent in 2020 and 2021 compared with the 2012-2019 average, and the metro area added more than 52,000 residents between 2020 and 2024, according to an analysis by the University of Virginia's Weldon Cooper Center.
The widespread adoption of remote work during the pandemic let people bring Washington-area salaries to a Richmond-area housing market, and prices adjusted accordingly. Richmond's median home price rose 5.1 percent in 2025 alone, from $370,000 to $389,975, one of the strongest-performing markets in the state according to Virginia Realtors. The same forces driving prices up statewide, that migration wave plus borrowed federal money that flowed disproportionately into Virginia for two decades, are now running into a state economy that is contracting while the housing and cost-of-living side of the equation shows no sign of slowing down.
Who Public Spending Ends Up Reaching
None of this was designed as one system. The employer health insurance deduction began as a workaround for wartime wage controls in the 1940s. The retirement account tax preferences accumulated bill by bill across decades of unrelated legislation. The decision to finance two wars almost entirely through borrowing was made incrementally, budget cycle by budget cycle, not as a single deliberate choice about how future generations would pay for them.
No one designed this to reach some people more than others. It does anyway. Every piece of it rewards something a person already has: an employer that offers coverage, enough spare income to invest in a tax-advantaged retirement account, a house bought before prices climbed. A system built from incentives layered onto existing advantage differentially impacts people the same way a deliberately unequal one would, without requiring anyone to have intended it.
That is what makes the opening finding both true and misleading at once. The United States ranks among the highest-spending countries in the developed world. But that spending reaches a homeowner with employer coverage and a 401(k) match far more reliably than it reaches the renter buying insurance on the individual market, or the worker whose employer offers no match at all.
The debate this country keeps having is over whether to spend more like Europe or less like Europe. The data says that argument was settled by spending levels a long time ago. What was never decided intentionally is who all that spending would end up reaching. That question does not get put to voters directly. It gets answered, quietly, every time Congress renews a tax preference, leaves one alone, or writes a new one.